Daily Chartbook #8
27 charts
Welcome to PAV Chartbook: market charts, data, research, and insights pulled from various sources around the Internet by a solo retail investor.
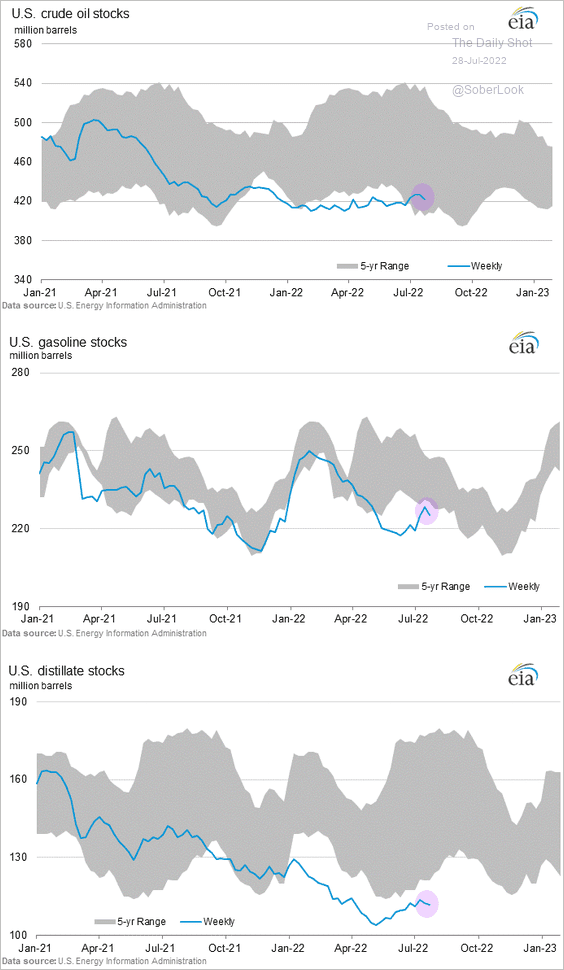
1. US O&G inventories. US crude oil, gasoline, and distillate stocks were all down last week.
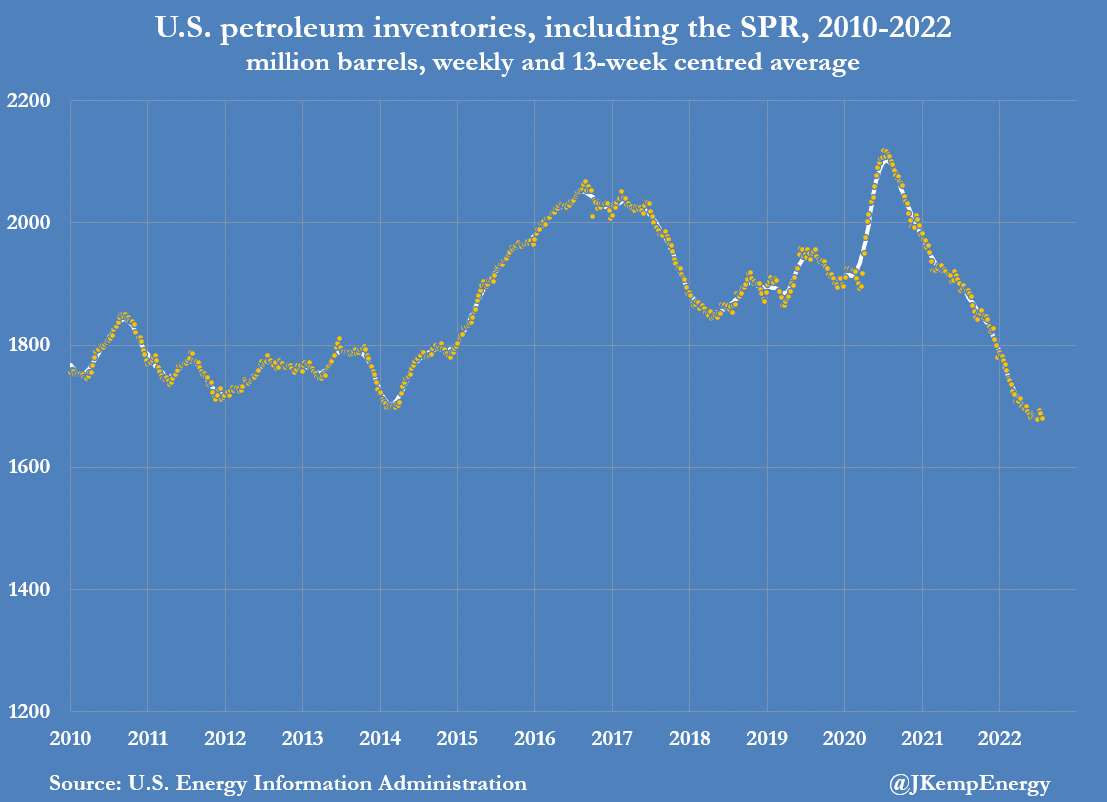
2. Depleting supplies. Overall US petroleum reserves have cratered despite record crude oil sales from the SPR (Strategic Petroleum Reserve) emergency stockpile.
3. US refinery runs. As crack spreads ease we’ve seen refinery runs decline sharply.
4. Product supplied. Meanwhile, US gasoline product supplied is well below the pre-pandemic average.
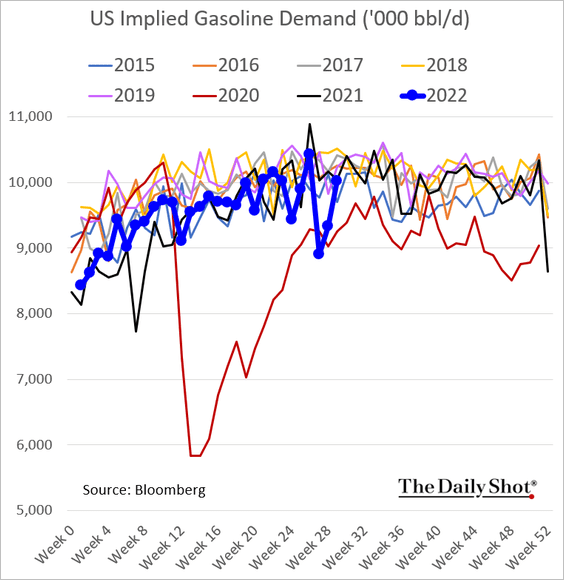
5. US gas demand. This is happening as we enter driving season with more cars on the road.
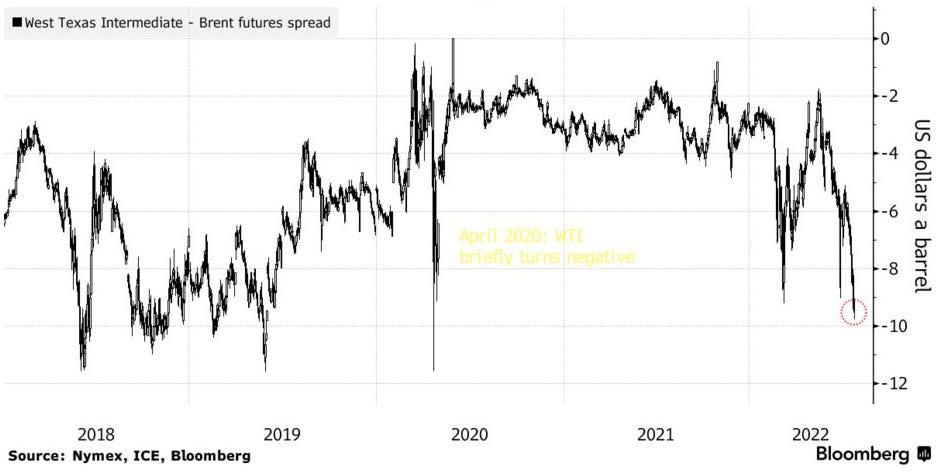
6. WTI - Brent discount. West Intermediate crude oil is trading at ~$10 discount to Brent, a gap that should narrow once SPR releases end.
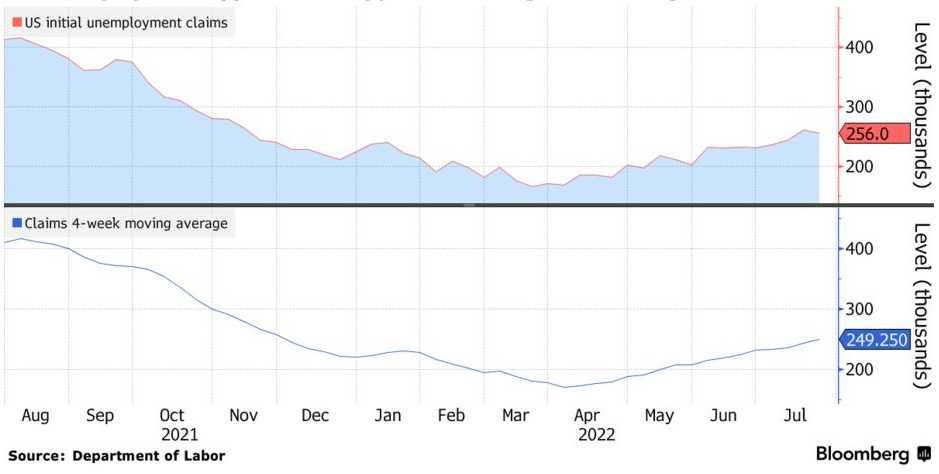
7. Good and bad. Initial jobless claims declined for the first time in 4 weeks, falling by 5k to 256k. Last week’s claims, however, were negatively revised up by +10k jobless claims.
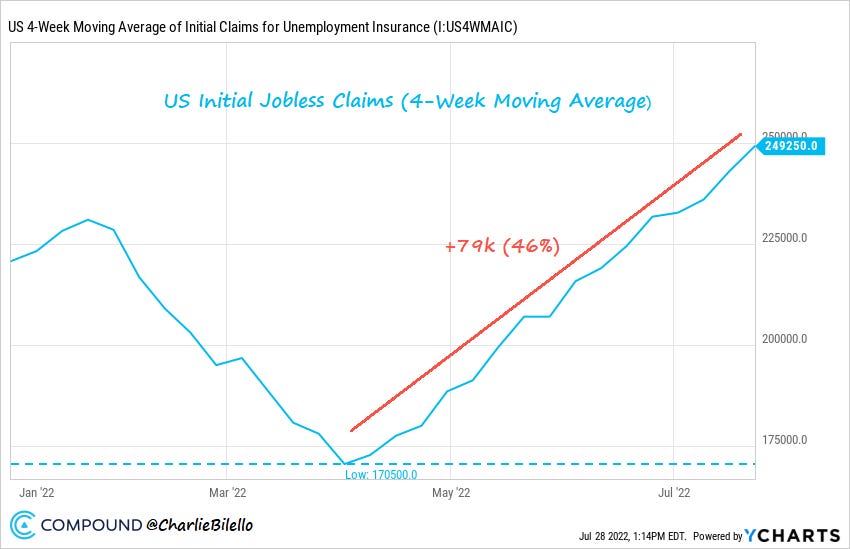
8. Leading indicator for jobs market. The 4-week average for initial jobless claims is 46% higher than its April low.
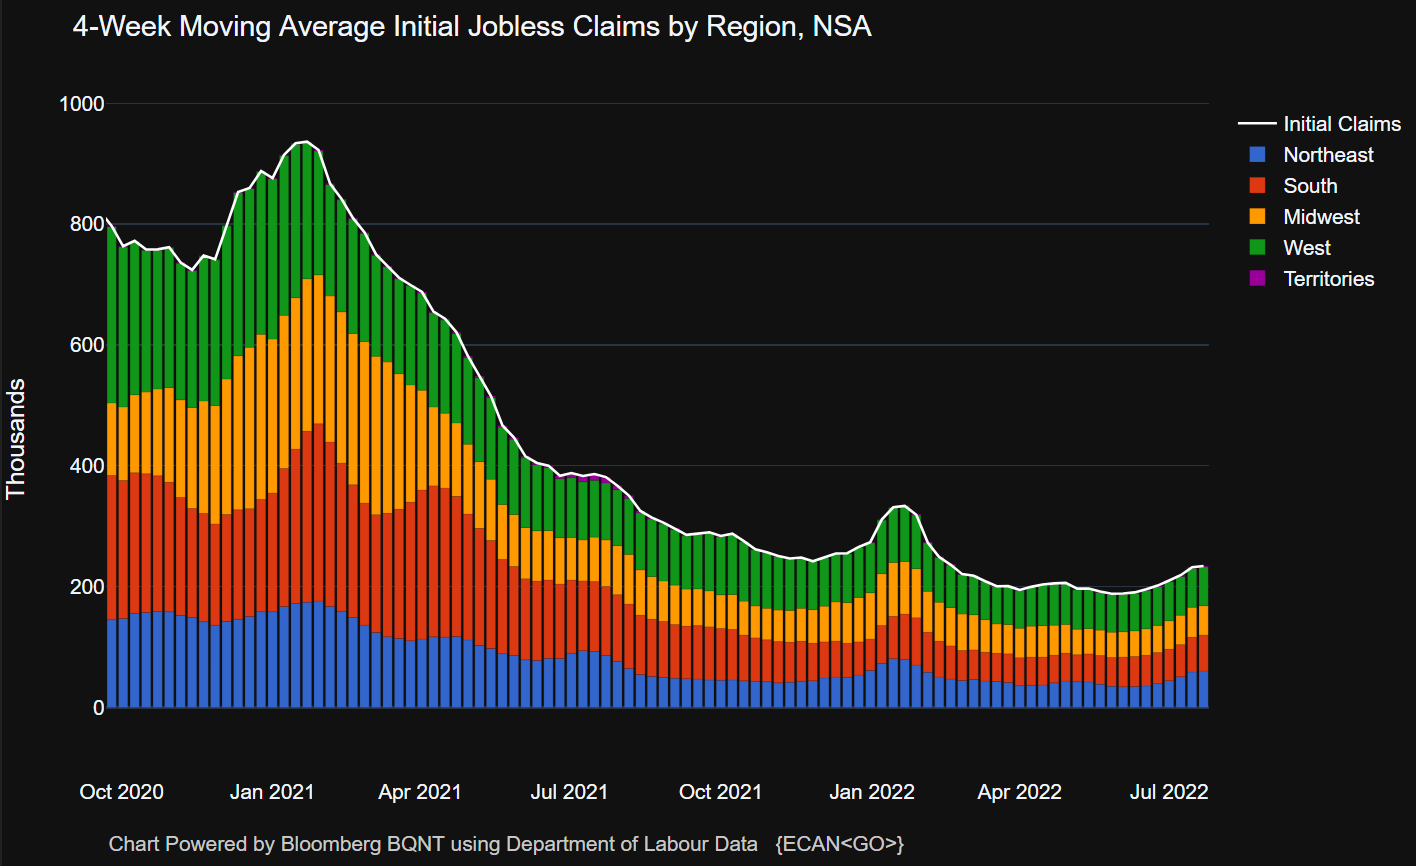
9. Can’t find work. Here’s a look at jobless claims by region.
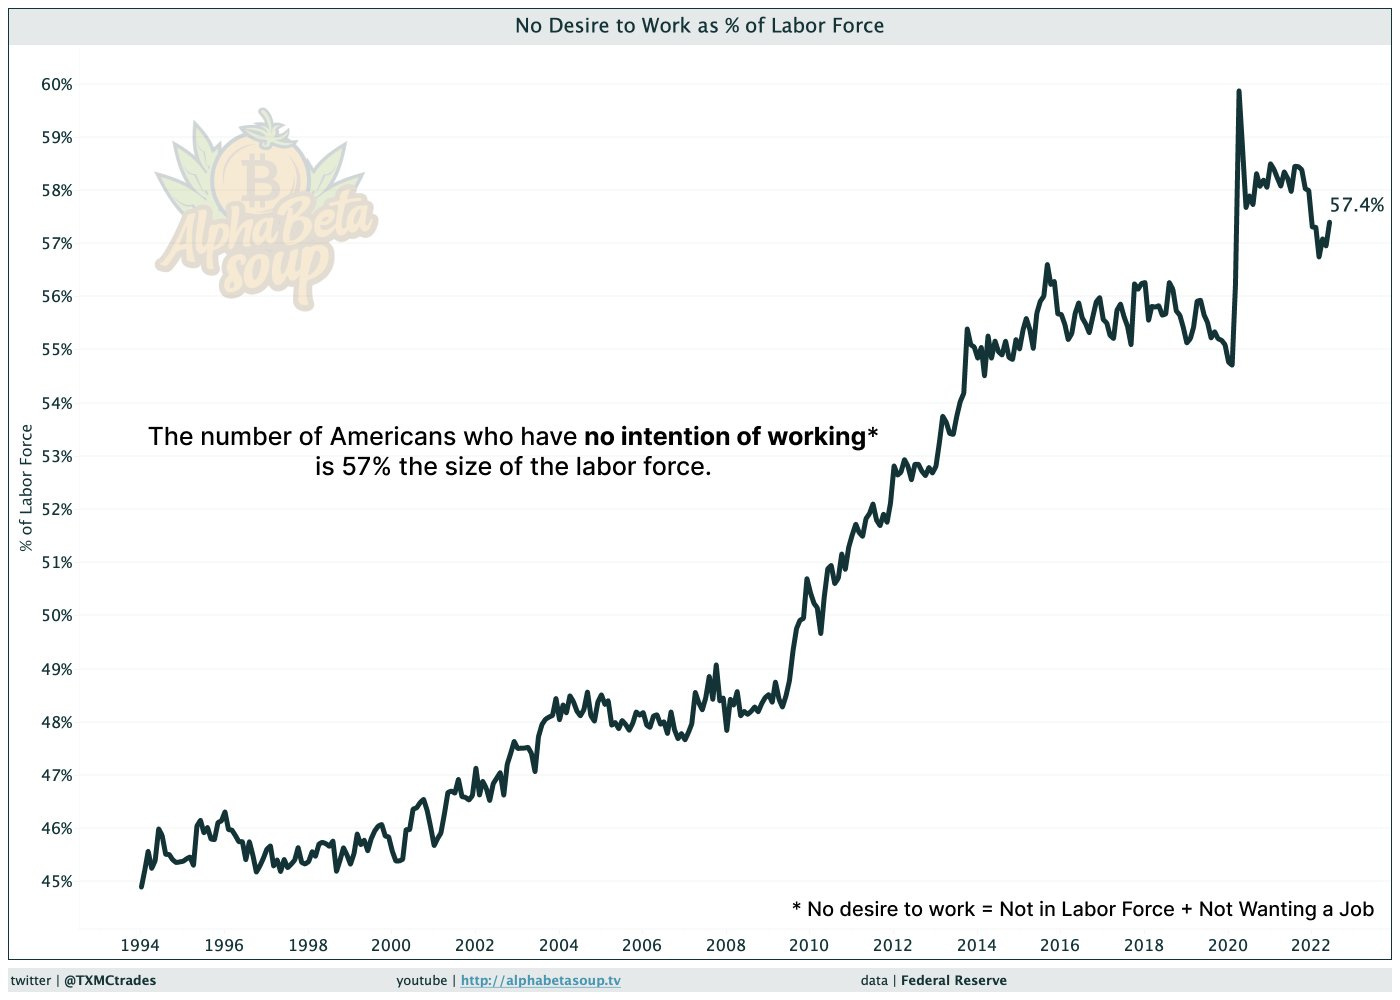
10. Don’t want to work. The share of Americans who are not interested in holding a job has been rising since 2000.
11. GDP. The US economy shrank 0.9% after sinking 1.6% in the first quarter.
12. Residential construction was a big drag on GDP. Unaffordable housing due to rising prices and surging mortgage rates resulted in a 14% drop in residential fixed investment.
Real vs. Nominal. If inflation didn’t exist GDP would be looking great. Unfortunately, it does, and adjusting for it knocks growth off trend.
13. There’s a chance... Today’s GDP print was -0.9 percentage points. It’s worth remembering the typical revision is 1.2 percentage points.
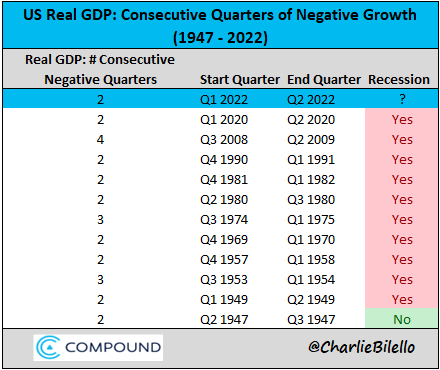
14. Recession. Plenty of semantics today. This should help: “The last 10 times the US had 2 or more consecutive quarters of negative Real GDP growth, the economy was in a recession. You have to go back to 1947 to find an exception.”
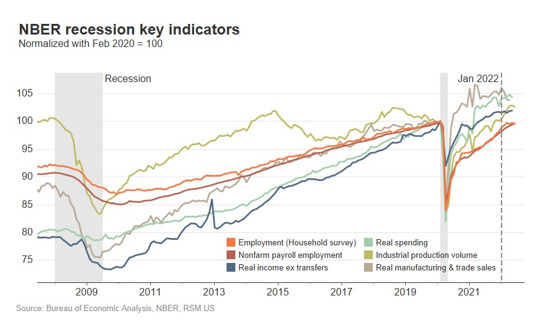
15. “Officially”. Anyway, here are the indicators the National Bureau of Economic Research is looking at.
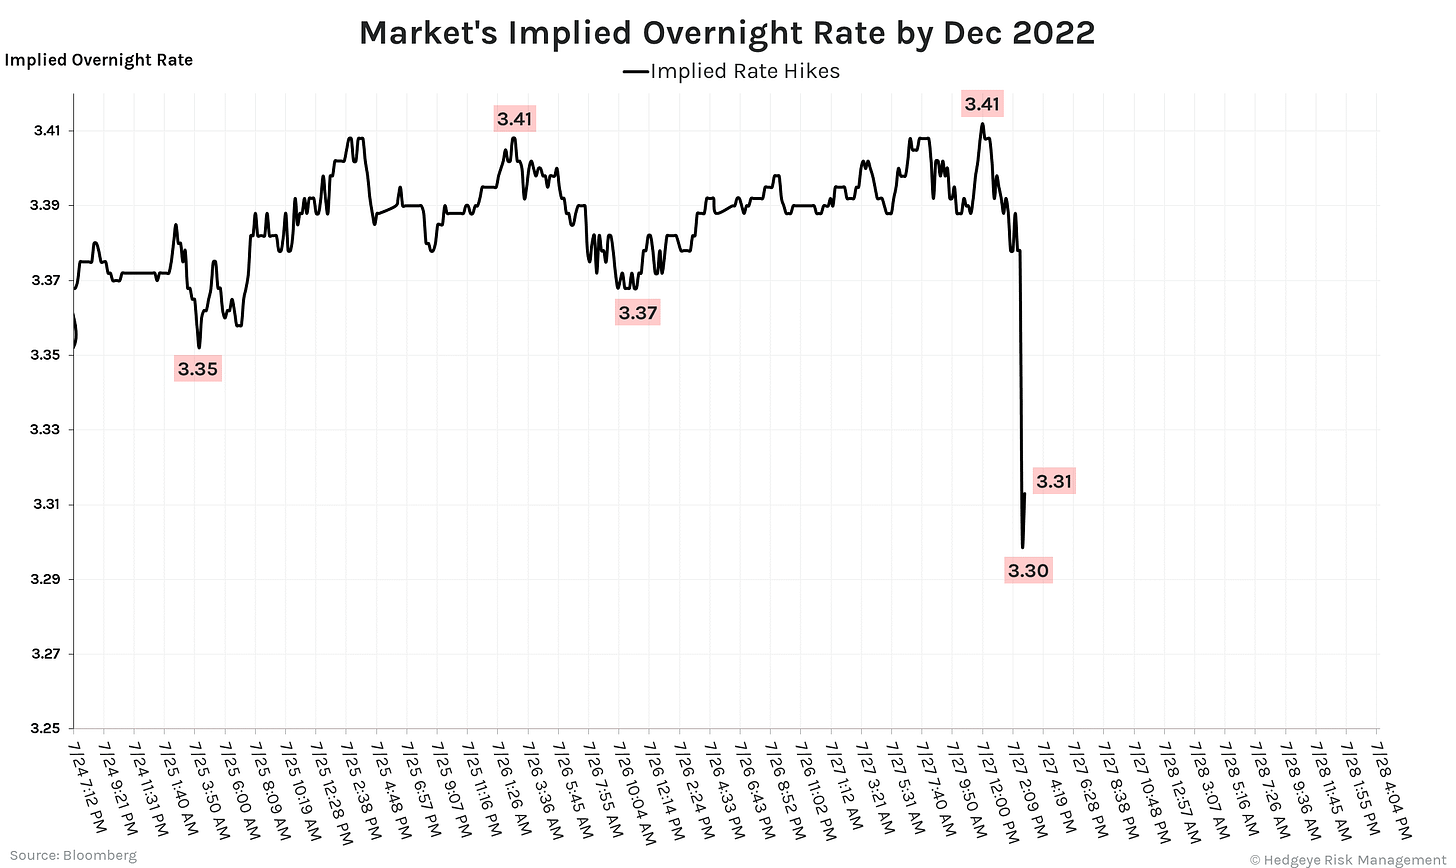
16. Next hike. The market is implying a 60-bps hike in September.
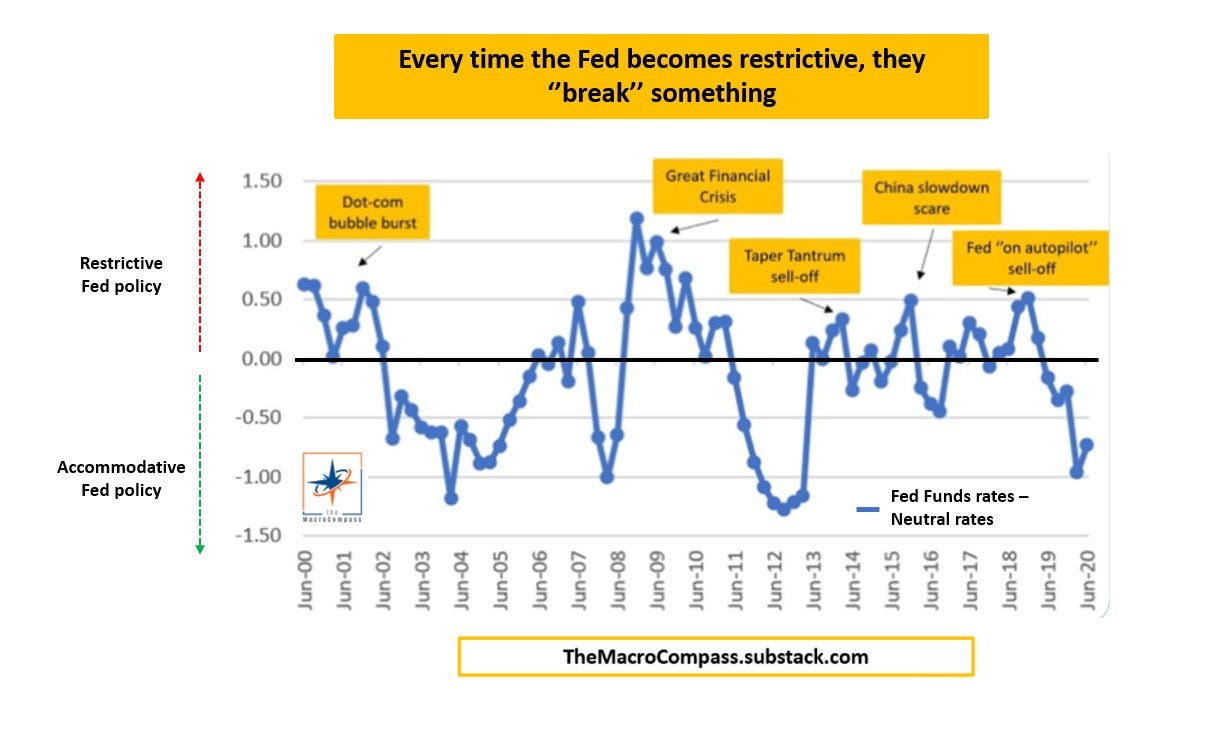
17. Fed is in line with neutral interest rates. “Powell is more careful now that the Fed feels they reached neutral rates: why? Because every time the Fed hiked above that (restrictive policy) it ended up breaking something. Every single time.”
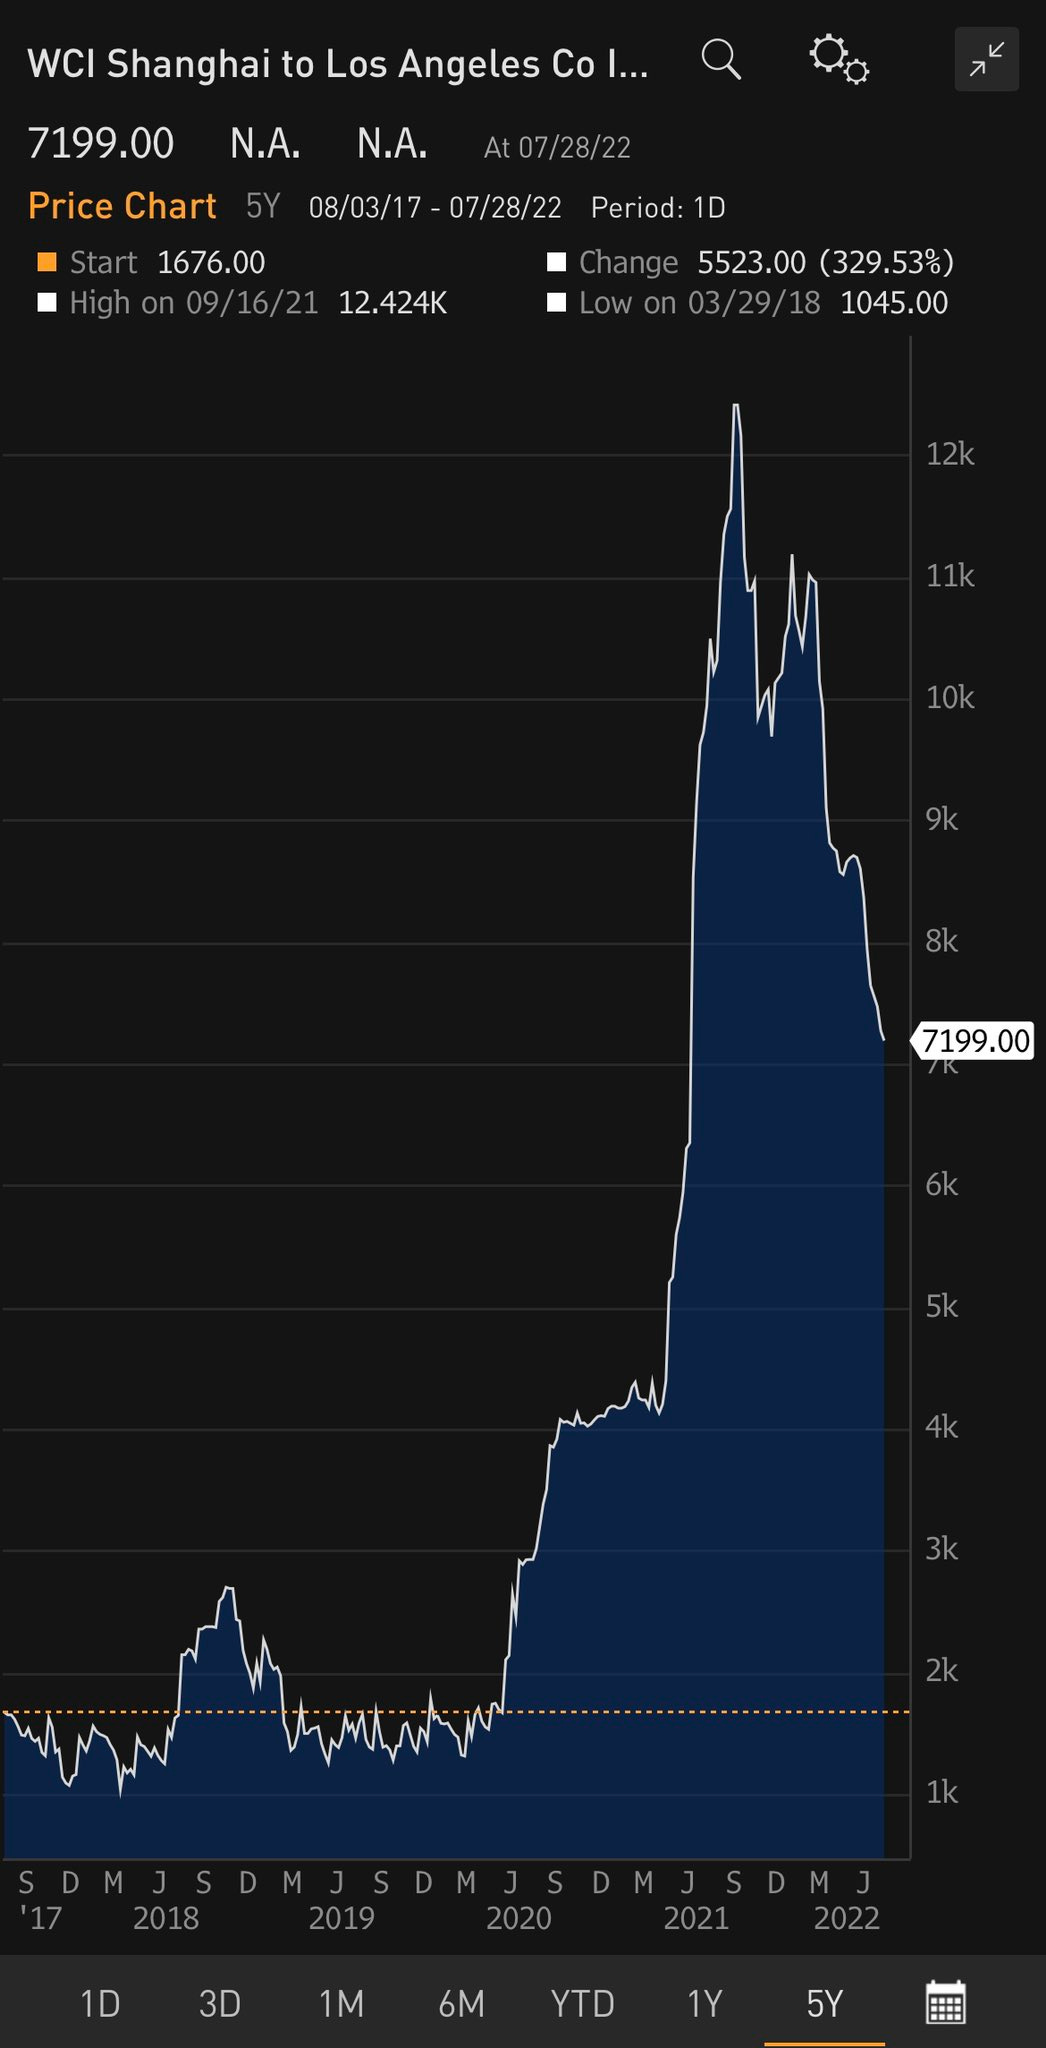
18. Freight prices. Yesterday we noted that global air freight rates were coming down. Ocean freight rates from Shangai to LA have been falling at an annualized rate of 50%+ since March.
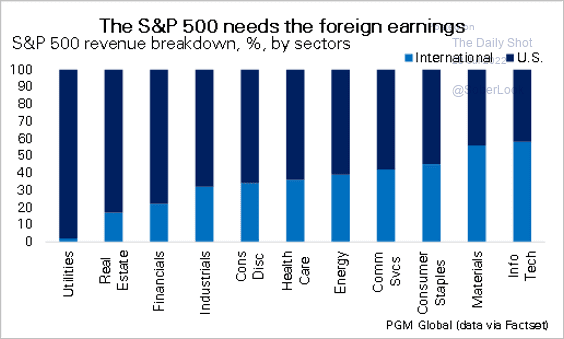
19. International sales. Yesterday we also mentioned that higher exposure to foreign sales meant higher earnings and revenue growth. Here's the S&P 500's foreign revenue breakdown by sector.
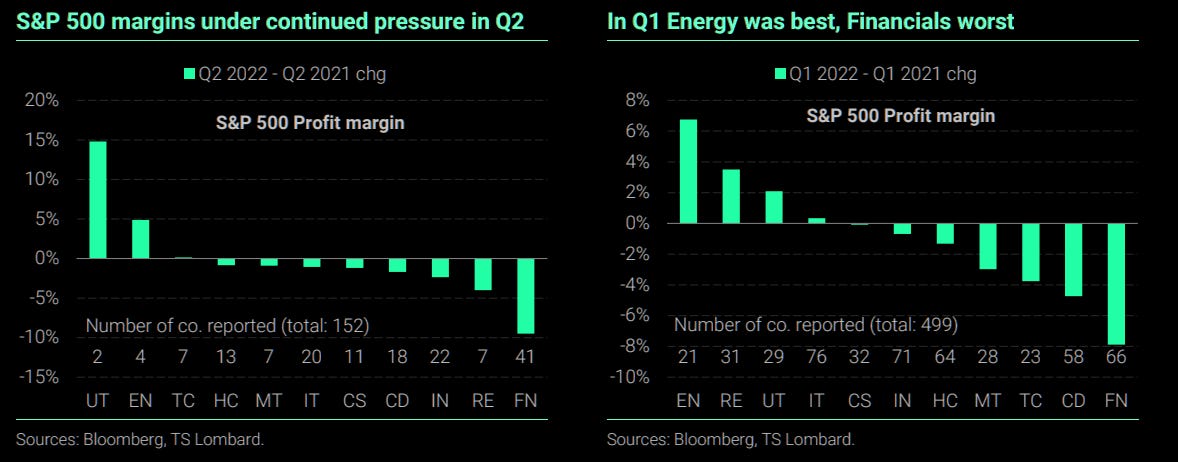
20. Margins under pressure. Cost inflation is outpacing sales and profit margins are declining throughout the S&P 500 (with the familiar exception of energy).
21. Dividends & manufacturing. We’ve covered the decline in manufacturing extensively over the last week. High-dividend stocks have historically performed well in this environment.
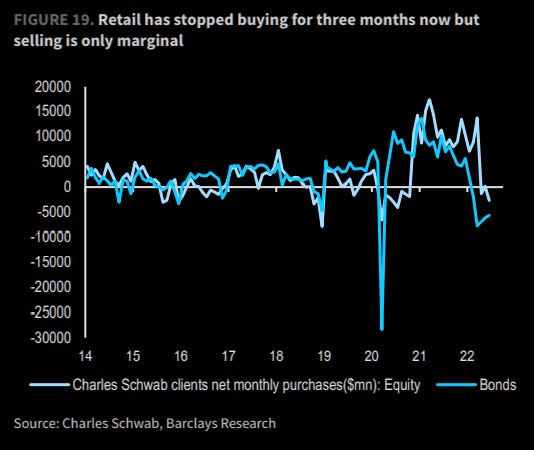
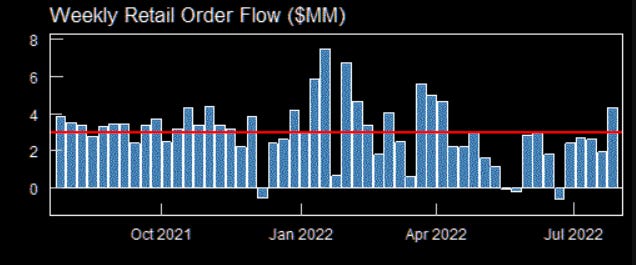
22. Foot off the gas. Retail investors have sharply slowed down their buying of stocks over the last 3 months.
23. But they’re back in full force. Retail investors picked up $4.3B in equities over the last week. It’s the “first time weekly retail net buying exceeded annual average since early April”.
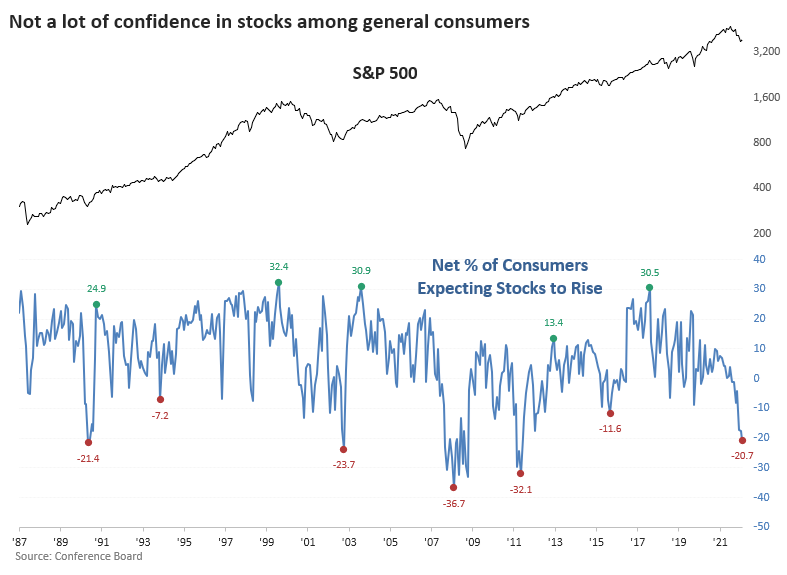
24. Not confident though. However, consumers don’t have high expectations for stock prices
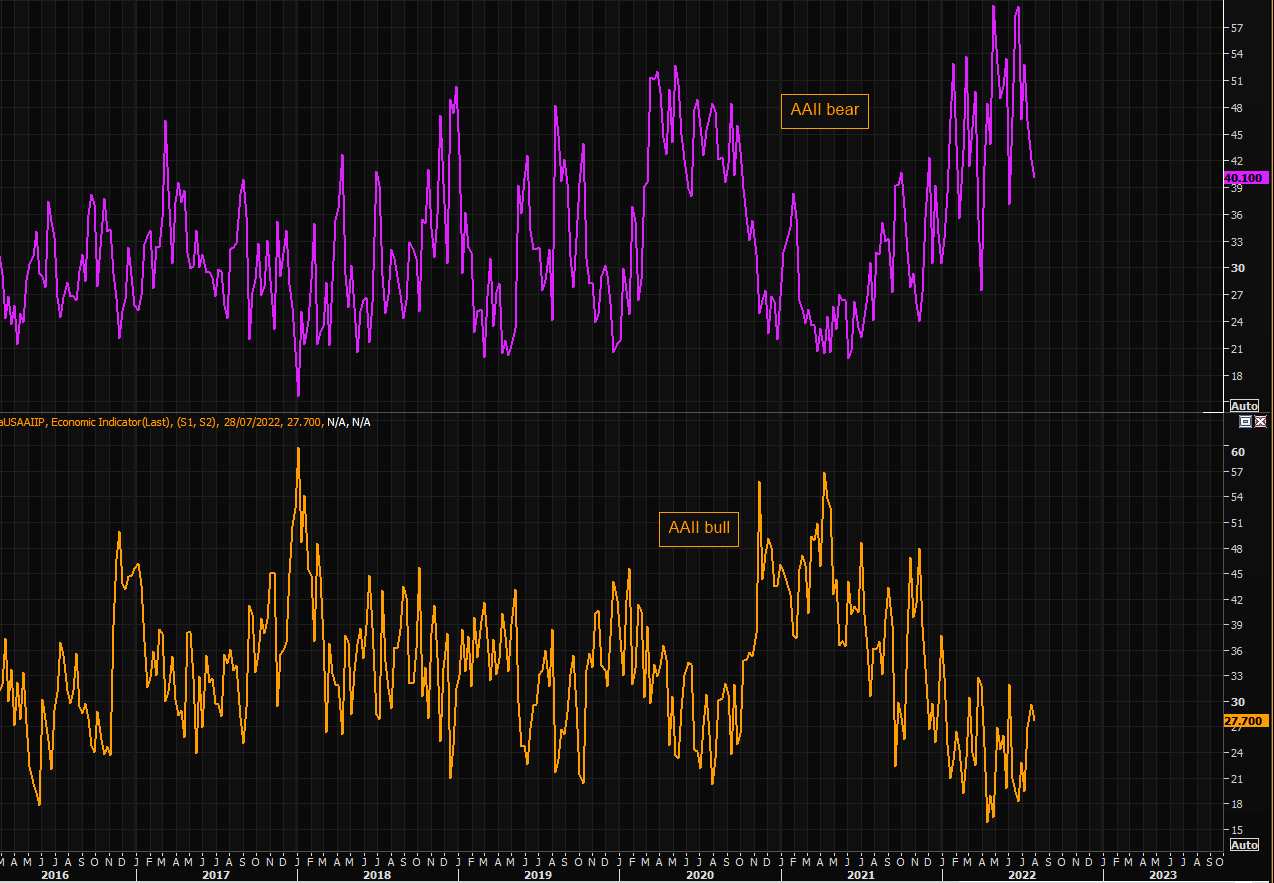
25. AAII bears. Individual investors have eased their bets against the market.
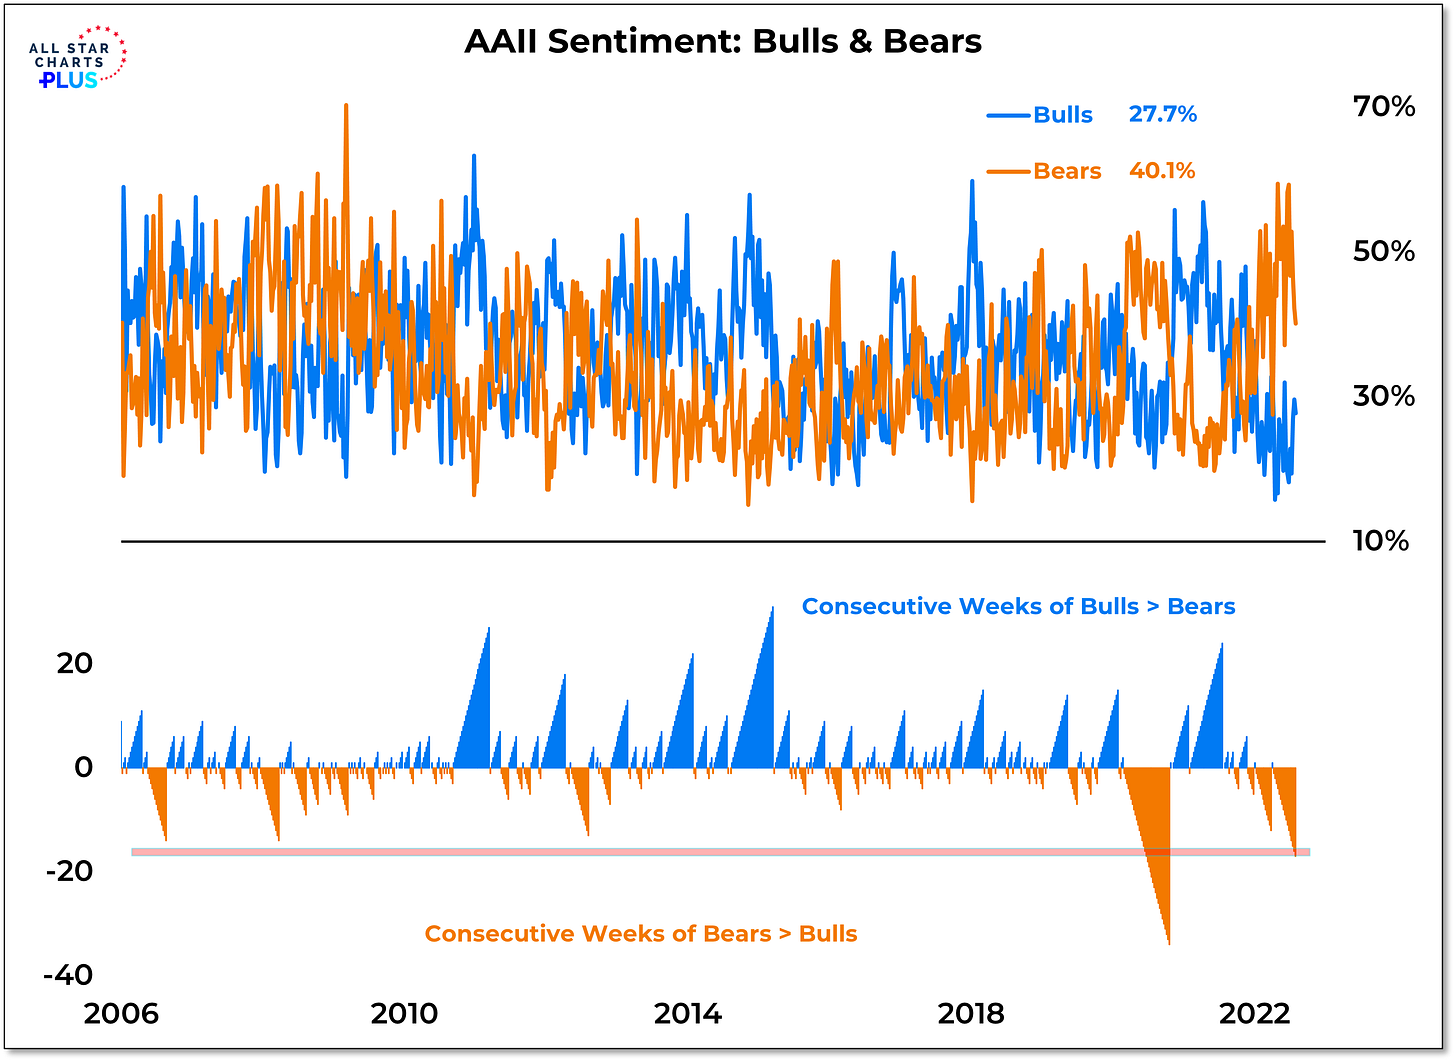
26. AAII bulls & bears. But they’re not partaking in the rally as bears have outnumbered bulls for 17 consecutive weeks.
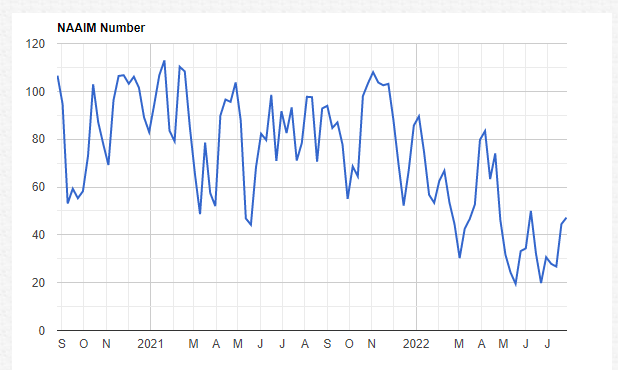
27. NAAIM. And finally, active investment manager exposure remains low but has ticked up.


